
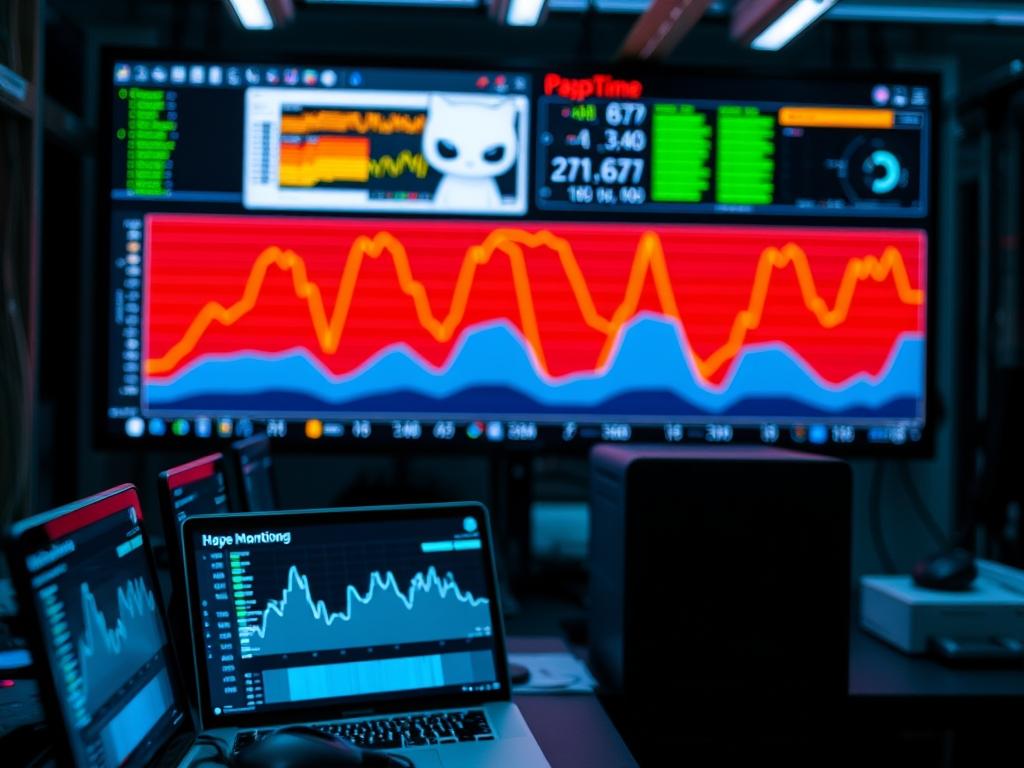
Upptime GitHub Monitoring represents a paradigm shift in distributed systems observability by leveraging the native infrastructure of GitHub Actions to execute high-frequency availability checks. In the context of critical infrastructure such as energy grid telemetry, water treatment control systems, or global cloud networks, the primary challenge is maintaining a secondary, out-of-band monitoring layer that remains functional even when the primary network experiences total failure. Traditional monolithic monitoring solutions often reside within the same failure domain as the services they observe. Upptime solves this by utilizing GitHub’s geographically distributed runners to perform external probes. This architectural strategy creates a decoupled monitoring environment where the status page and the monitoring logic are encapsulated within a Git repository. This ensures that the state of the infrastructure is recorded in an idempotent manner; every check results in a commit that serves as a permanent, version-controlled log of system behavior. By reducing the overhead of maintaining dedicated monitoring servers, organizations can mitigate the risks of signal-attenuation in complex network paths and ensure high-fidelity reporting of latency and packet-loss.
Technical Specifications
| Requirement | Default Port/Operating Range | Protocol/Standard | Impact Level (1-10) | Recommended Resources |
| :— | :— | :— | :— | :— |
| GitHub Actions Runner | HTTPS (Port 443) | TLS 1.2/1.3 | 9 | 2-core CPU / 7GB RAM |
| API Communication | REST / GraphQL | IEEE 802.3 | 7 | Minimal Overhead |
| Data Persistence | Git / File System | POSIX | 8 | 500MB+ Repository Space |
| Monitoring Probes | ICMP / TCP / HTTP | IPv4/IPv6 | 10 | Low Latency Connection |
| Authentication | 256-bit Personal Access Token | OAuth2 / Scopes | 9 | Secure Key Storage |
The Configuration Protocol
Environment Prerequisites:
Implementation requires a GitHub account with Actions enabled and a dedicated repository created from the Upptime template. Users must possess the repository:write and workflow:write permissions to allow the automated runners to commit status updates. From a software perspective, the environment relies on Node.js runtimes within the GitHub-hosted virtual environments. Standard compliance requires that all automated interactions follow the GitHub Terms of Service regarding API rate limits to prevent temporary IP blocks or service throttling. If monitoring internal hardware like logic-controllers or industrial sensors, a secure gateway or tunnel must be established to permit the GitHub runner to reach the internal endpoint without compromising the local firewall integrity.
Section A: Implementation Logic:
The engineering design of Upptime centers on the concept of “Infrastructure as Code” (IaC) transposed onto monitoring. The setup uses a central configuration file, .upptimerc.yml, which acts as the single source of truth for the entire monitoring stack. When a GitHub Action triggers on a specific cron schedule, it instantiates a virtual container that pulls this configuration. The monitoring script then executes a series of asynchronous requests to the target URIs. Because these checks are run from various GitHub data centers, the results provide a realistic view of global latency and availability, bypassing local network biases. This encapsulation of monitoring logic within a version-controlled repository ensures that any changes to the monitoring perimeter are audited, reversible, and transparent to the entire engineering team.
Step-By-Step Execution
1. Repository Instantiation and Template Adoption:
Navigate to the Upptime GitHub organization and select the “Use this template” option to create a new repository under the desired organization or user account.
System Note: This action performs a shallow clone of the monitoring framework into your namespace. This provides the basic directory structure including the .github/workflows path, which is essential for the GitHub Actions engine to recognize the scheduled jobs.
2. Provisioning the Personal Access Token (PAT):
Generate a Personal Access Token with repo, workflow, and user scopes. Navigate to the repository settings, then to “Secrets and variables,” and create a new repository secret named GH_PAT.
System Note: This token is used by the git push command within the runner. Without this specific secret, the runner cannot update the README.md or the status page files, leading to a permission denied error in the workflow logs.
3. Modifying the Global Configuration File:
Open the .upptimerc.yml file in the root directory. Define the sites to be monitored by adding their names and URLs under the sites key.
System Note: The monitoring engine parses this YAML file to generate the execution matrix. Ensure that the syntax is strictly compliant; even a single indentation error creates a parsing failure that will halt the uptime-monitor service during the initialization phase.
4. Configuring Workflow Triggers and Intervals:
Locate the file at .github/workflows/uptime.yml. Adjust the schedule parameter using standard cron syntax to define how frequently the checks should occur.
System Note: Increasing the frequency reduces the latency of incident detection but increases the probability of hitting GitHub API rate limits. For enterprise-grade infrastructure, a 5-minute interval is generally considered the optimal balance between throughput and resource consumption.
5. Finalizing the Status Page and Deploying:
Commit all changes to the master or main branch. This trigger initiates the first run of the setup and uptime workflows.
System Note: The system calls the npm install and npm run build commands within the runner. This process compiles the static status page and pushes it to the gh-pages branch. You may need to enable “GitHub Pages” in the repository settings, pointing the source to the gh-pages branch to make the status dashboard publicly accessible.
Section B: Dependency Fault-Lines:
The most common point of failure is “Token Expiry” or “Insufficient Scopes” on the GH_PAT. If the execution log shows a 403 Forbidden error, the token must be regenerated. Another bottleneck is the “Concurrent Workflow Limit.” If an organization has too many active Actions, the uptime checks may be queued, leading to perceived gaps in monitoring data and artificial spikes in reported latency. Furthermore, network-level “Signal-Attenuation” or firewall “IP-Filtering” at the target site might block GitHub’s IP ranges. In such cases, the target’s iptables or security groups must be updated to whitelist the official GitHub Actions IP ranges provided via their meta API endpoint.
THE TROUBLESHOOTING MATRIX
Section C: Logs & Debugging:
When a monitoring check fails, the first point of inspection is the GitHub Actions tab. Search for the “Uptime CI” workflow. If the status is red, click the run to view the raw logs.
– Error Code EAI_AGAIN: This signifies a DNS resolution failure. Verify the domain name in .upptimerc.yml.
– Error Code ECONNREFUSED: The target server is active but rejecting connections on the specified port. Check the service status via systemctl status on the host machine.
– Error Code 404 Not Found: The endpoint path is incorrect. Use curl -I [URL] to verify the path’s validity.
– Fault Code ETIMEDOUT: The server did not respond within the allotted window. This often indicates high “thermal-inertia” in server response or significant “packet-loss” in the transit provider’s network.
For log analysis at the kernel level of the runner (rarely needed but useful for deep audits), use the cat /var/log/syslog command if using a self-hosted runner; otherwise, rely on the detailed output generated by the uptime-monitor script which logs the full HTTP response headers for each failed request.
OPTIMIZATION & HARDENING
– Performance Tuning: To maximize throughput, use the parallel execution feature in the configuration. This allows the runner to probe multiple endpoints simultaneously rather than sequentially, significantly reducing the total execution time for large-scale environments with hundreds of monitored assets.
– Security Hardening: Implementation of the “Least Privilege” principle is critical. Ensure the GH_PAT is limited to only the monitoring repository. Use GitHub’s “Environment Secrets” to add an extra layer of protection, requiring manual approval for any changes to the monitoring secret variables. Enable “Dependabot” on the repository to automatically patch vulnerabilities in the underlying monitoring libraries.
– Scaling Logic: As the number of monitored endpoints increases, the “payload” size of the repository grows due to historical data commits. To maintain performance, implement a “Git Garbage Collection” workflow or periodically squash the commit history of the gh-pages branch. This prevents large repository sizes from slowing down the git clone operations required at the start of every workflow run.
THE ADMIN DESK
How do I fix a consistent 403 error on the status page?
Ensure your GH_PAT has the workflow scope enabled. This is the most frequent cause. If the token is valid, check if your GitHub account has reached its hourly API rate limit due to other concurrent workflows.
Can I monitor local infrastructure behind a NAT?
Yes; utilize a tool like ngrok or a private VPN tunnel to expose the local service to a public URL. Alternatively, deploy a “GitHub Self-Hosted Runner” within your local network to execute the checks internally while reporting to GitHub.
How do I adjust the sensitivity of the downtimes?
Modify the threshold value in .upptimerc.yml. A higher threshold requires more consecutive failed checks before an incident is officially recorded, helping to filter out “false-positives” caused by transient network jitter or momentary signal-attenuation.
What happens if the GitHub Actions platform itself goes down?
This is the “Monitor the Monitor” problem. For high-availability environments, it is recommended to have a dual-setup: one repository on GitHub and a secondary mirror on a GitLab instance using GitLab CI/CD to ensure redundant observability paths.
How do I resolve ‘Merge Conflicts’ in the monitoring data?
This occurs if multiple workflows try to commit to the repository at once. Upptime is designed to handle this, but if it persists, increase the interval between runs in the uptime.yml cron schedule to reduce concurrency conflicts.

